Image Details
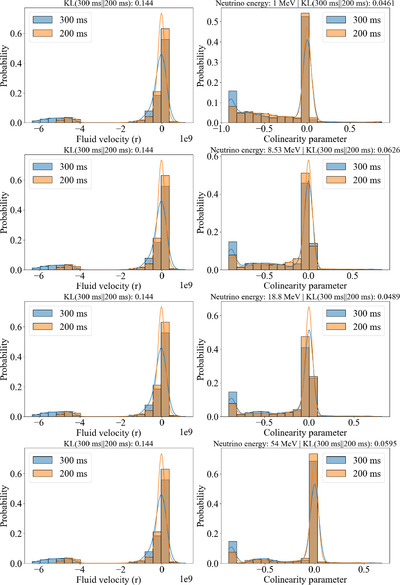
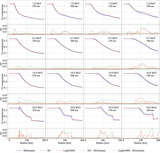
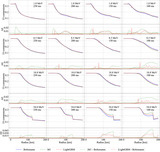
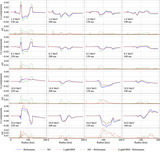
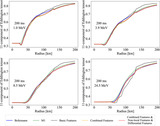
Caption: Figure 11.
Probability distributions of fluid velocity (“Fluid velocity (r)”) and the collinearity parameter (“collinearity parameter”) for neutrinos with the energy of 1.0, 8.5, 18.8, and 54.0 MeV. Each row corresponds to one of these neutrino energies. The data sets at 300 ms and 200 ms post-bounce are colored blue and orange, respectively. The histograms and kernel density estimation plots illustrate the statistical difference between these two data sets for each neutrino energy level. The value of the KL divergence is given in the plots to quantify the extent of the differences.
Other Images in This Article

Copyright and Terms & Conditions
© 2025. The Author(s). Published by the American Astronomical Society.
Copyright ©
2026 Astronomy Image Explorer. All Rights Reserved.