Image Details
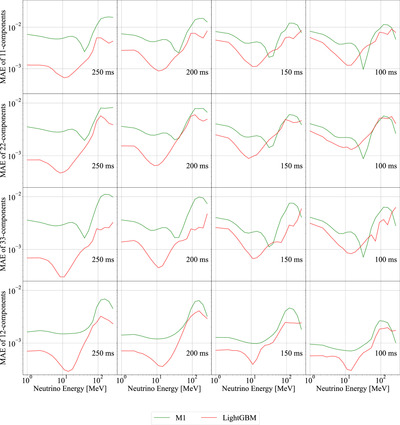
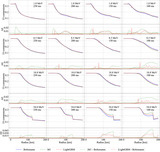
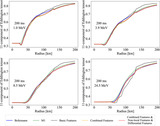
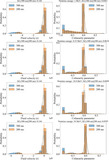
Caption: Figure 3.
Relationship between neutrino energy and prediction error. Each row corresponds to the plots of ﹩{k}_{{\rm{FP}}}^{11}﹩, ﹩{k}_{{\rm{FP}}}^{22}﹩, ﹩{k}_{{\rm{FP}}}^{33}﹩, and ﹩{k}_{{\rm{FP}}}^{12}﹩ from top to bottom, while each column represents the plots for 250, 200, 150, and 100 ms after the core bounce from left to right. The green and red lines represent the MAE obtained using the M1 closure relation and our LightGBM prediction, respectively.
Other Images in This Article

Copyright and Terms & Conditions
© 2025. The Author(s). Published by the American Astronomical Society.
Copyright ©
2026 Astronomy Image Explorer. All Rights Reserved.