Image Details
Caption: Figure 2.
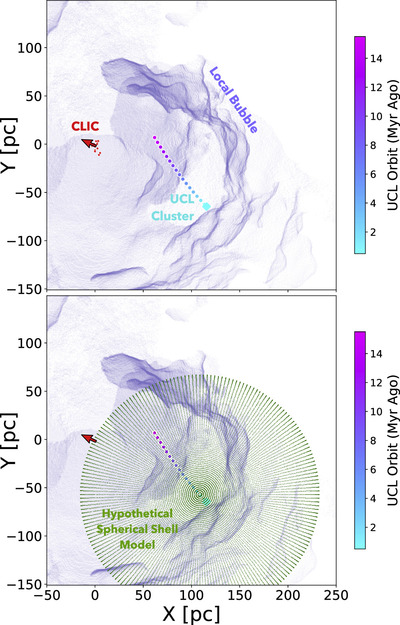
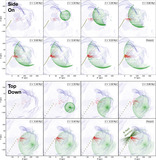
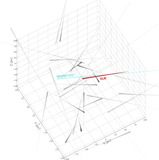
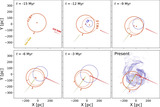
Top: present-day position of the UCL stellar cluster (cyan diamond) and the CLIC (red dots). The average 3D space motion of the CLIC (red arrow) is also shown. The colored path shows the trajectory of the UCL cluster from its birth 16 Myr ago to the present day, colored by time in the past. The current 3D space motions and 3D positions of the CLIC clouds with respect to UCL may be explained by a supernova that exploded in the cluster within the past ≈1−2 Myr, potentially sweeping up the tenuous material inside the pre-evacuated Local Bubble cavity and forming the CLIC. A present-day model for the Local Bubble (structured purple surface; T. J. O’Neill et al. 2024b) is constrained by the observed 3D distribution of dust (G. Edenhofer et al. 2024), and is the same model shown in the bottom-right panel of Figure 1. Bottom: we overlay a hypothetical model for a spherical shell remnant (green points) for a supernova that may have gone off 1.78 Myr ago in UCL (e.g., R. Neuhäuser et al. 2020), adopting a shell radius that places the CLIC on its surface in the present day. The current space motion of the CLIC (red arrow) is nearly perpendicular to the surface of such a shell.
Other Images in This Article
Copyright and Terms & Conditions
© 2025. The Author(s). Published by the American Astronomical Society.