Image Details
Caption: Figure 6.
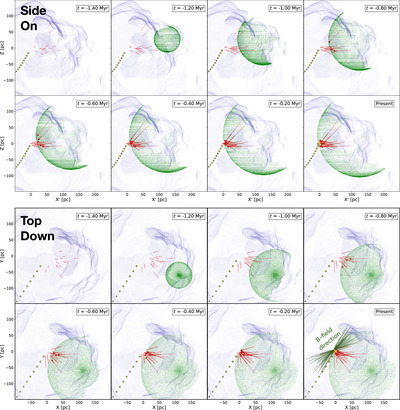
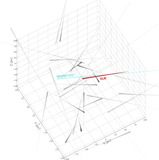
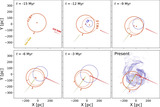
Proposed scenario for the formation of the CLIC on the surface of an expanding shell, stemming from the most recent supernova explosion in the UCL cluster. The top set of panels shows a side-on view of the evolution (rotated 20∘ counterclockwise for an observer facing the Galactic center, denoted by ﹩{X}^{{\prime} }﹩), while the bottom set of panels shows a top-down view. Each subpanel shows the CLIC (red points), the Sun’s trajectory (yellow points), and the expanding supernova shell (green sphere) at specific time snapshots, spanning t = −1.4 Myr to t = 0 Myr (present day). A model for the Local Bubble at t = 0 Myr (purple surface; T. J. O’Neill et al. 2024b) is also overlaid and is presumed to not have changed significantly over the past ≈1.4 Myr, since the cavity was largely carved out by previous supernovae beginning ≈14 Myr ago (C. Zucker et al. 2022). The supernova exploded at texp = −1.22 Myr. Prior to their birth, the trajectories of the individual CLIC clouds are shown with semitransparent red traces meant to guide the eye. After their birth in the expanding shell, the positions of the CLIC clouds are shown with large red dots. The present-day top-down subpanel additionally shows constraints on the local interstellar magnetic field direction (thin green lines; P. C. Frisch et al. 2022), indicating that the magnetic field is roughly tangent to the shell. An interactive version of this figure is available. A copy is also available online (https://faun.rc.fas.harvard.edu/czucker/Paper_Figures/Interactive_CLIC_Formation.html). The interactive figure was created with plotly. In the upper-right corner are the standard plotly commands that allow one to pan, rotate, zoom, and reset the figure. In addition, the user can play the orbital histories of the CLIC forward and backward in time either through the buttons or by sliding the time slider. Lastly, different orbits and models can be shown or hidden by clicking the labels in the upper right.
(An interactive version of this figure is available in the online article.)
An interactive version of this figure is available.
An interactive version of this figure is available in the online journal.
Other Images in This Article
Copyright and Terms & Conditions
© 2025. The Author(s). Published by the American Astronomical Society.