Image Details
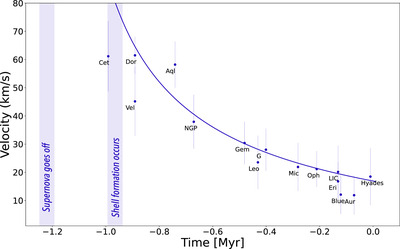
Caption: Figure 5.
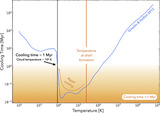
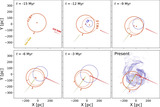
Velocity evolution of the supernova shell and the CLIC clouds. The thick blue line shows the velocity of the shell as a function of time (vsh + δvsh in the context of Figure 3 and Equation (4)), defined by the median of the samples from the dynesty run. The blue dots show the velocity of the CLIC clouds when they intersect the surface of the expanding shell, providing a prediction for the ages of the individual clouds. The error bars on the blue dots show the error on the cloud velocities inferred as part of our modeling. Cloud formation is predicted to occur roughly on or after the onset of shell formation at tsf = −0.97 Myr, or ≈250,000 yr after the supernova exploded at texp = −1.22 Myr.
Other Images in This Article
Copyright and Terms & Conditions
© 2025. The Author(s). Published by the American Astronomical Society.