Image Details
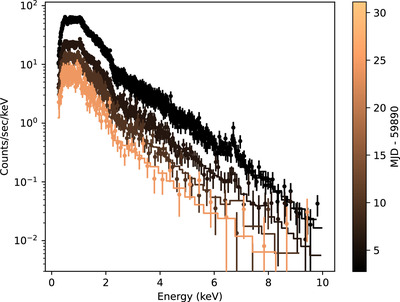
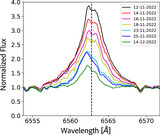
Caption: Figure 8.
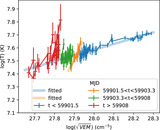
Evolution of NICER spectra during the flare; shown are four spectra from one orbit each. Spectra are binned to a minimum of 25 counts bin–1. Colors correspond to the time of the observation.
Other Images in This Article
Copyright and Terms & Conditions
© 2024. The Author(s). Published by the American Astronomical Society.
Copyright ©
2025 Astronomy Image Explorer. All Rights Reserved.