Image Details
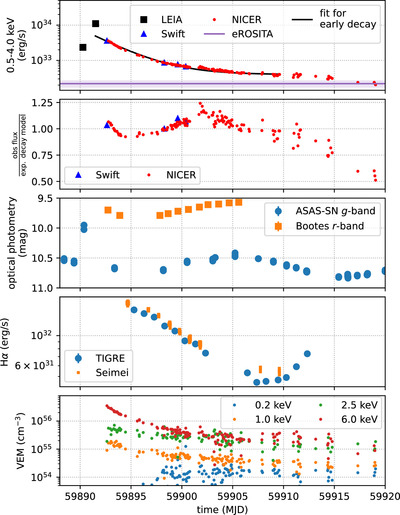
Caption: Figure 7.
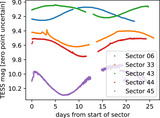
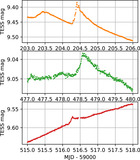
Lightcurve for HD 251108. Where error bars are invisible, the statistical uncertainties are smaller than the plot symbols. Top: absorbed X-ray flux in the 0.5–4.0 keV range. The average flux in eRASS is marked by a purple line, and the observed variability (shaded) is also consistent with the XMM-Newton and ROSAT fluxes. The black line shows the best-fit exponential decay fitted to the early decay phase; see Section 3.2.1 for details. Second panel: ratio between X-ray flux and the simple exponential decay model. Third panel: g-band lightcurve from ASAS-SN. The survey uses different telescopes, and there are small systematic offsets between individual cameras that cause almost simultaneous measurements to differ slightly. Fourth panel: EW of the Hα emission line. Bottom: volume emission measure of the flare from a fit with four components at fixed temperature and abundance. See Section 3.2.3 for details. The hotter flare components decay faster, while the 0.2 keV component is mostly stable. Error bars are omitted for clarity. A full listing of all NICER observations and all the data in this figure (except for the two data points from LEIA; see Z. X. Ling et al. 2022) and Figure 9 are available as “data behind the figure.”
(The data used to create this figure are available in the online article.)
(The data used to create this figure are available.)
Other Images in This Article
Copyright and Terms & Conditions
© 2024. The Author(s). Published by the American Astronomical Society.