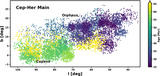
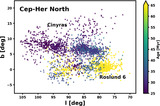
Image Details
Caption: Figure 18.
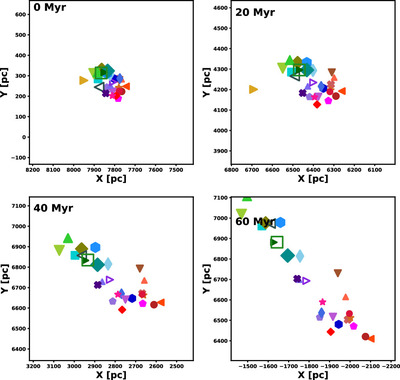
Simulation of the evolution of the Orpheus Association over the next 60 Myr, presented in XY galactic coordinates. The markers match those used in Figure 10, where bound clusters or groups with a bound component are marked with an open icon. Each marker shows the mean location of a subgroup, with the marker size scaled with the group mass. The interactive figure provides an interactive view of these results in 3D, and also provides more time steps over a longer span of time.
An interactive version of this figure is available in the online article.
An interactive version of this figure is available.
An interactive version of this figure is available in the online journal.
Other Images in This Article
Show More
Copyright and Terms & Conditions
© 2024. The Author(s). Published by the American Astronomical Society.