Image Details
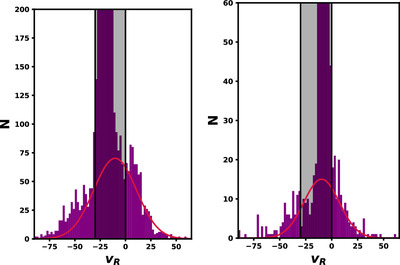
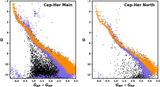
Caption: Figure 4.
Fits to the field contamination in Cep-Her Main and Cep-Her North. The purple histogram shows the distribution of RVs, while the red curve fits the sections of the distribution with (v R < −30 and v R > 0) where the field dominates. We apply dark shading to the Cep-Her-dominated range of RVs that we do not include in these fits.
Other Images in This Article
Show More
Copyright and Terms & Conditions
© 2024. The Author(s). Published by the American Astronomical Society.
Copyright ©
2025 Astronomy Image Explorer. All Rights Reserved.