Image Details
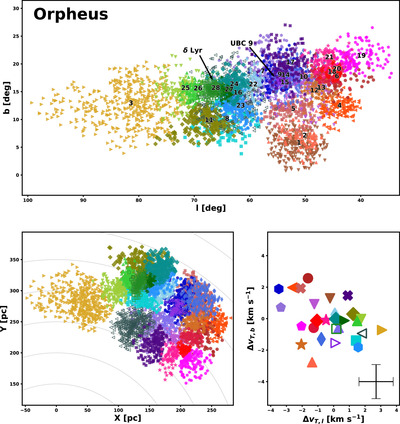
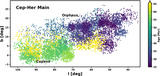
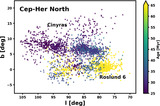
Caption: Figure 10.
Overview plot for the Orpheus Association, showing the distribution of groups in l/b sky coordinates (top), X/Y galactic coordinates (bottom left), and Δv T,l /Δv T,b transverse velocity anomaly (bottom right), measured relative to the mean UVW velocity vector. The transverse velocity anomaly plot shows average values to improve legibility, as the scatter of the groups overlap heavily. The mean velocity standard deviation for a subgroup is marked with the black error bars in the lower right of that panel. We annotate the subgroup IDs in the top panel. Members of bound open clusters or groups with a bound core as assessed in Section 5.7 are marked with open icons. We assign similar colors to qualitatively similar populations in spatial coordinates and age to aid visual comprehension. The gray curves are lines of equal distance drawn at 50 pc intervals, which indicate both the location of the Sun and the distance spread of the association. We also annotate the location of known bound clusters. We have included an interactive figure in galactic XYZ cartesian space that covers Orpheus as well as the other associations covered in Figures 11, 12, and 13. In that figure, associations can be shown and hidden using the legend, and the display can be rotated or zoomed as desired.
An interactive version of this figure is available in the online article.
An interactive version of this figure is available.
An interactive version of this figure is available in the online journal.
Other Images in This Article
Show More
Copyright and Terms & Conditions
© 2024. The Author(s). Published by the American Astronomical Society.