Image Details
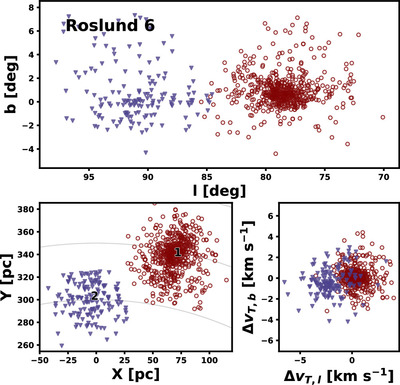
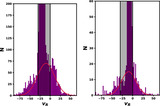
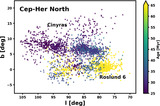
Caption: Figure 13.
Overview plot for Roslund 6. The axes and layout are the same as Figure 10; however, since there are only two subgroups, we show the entire velocity distribution.
Other Images in This Article
Show More
Copyright and Terms & Conditions
© 2024. The Author(s). Published by the American Astronomical Society.
Copyright ©
2025 Astronomy Image Explorer. All Rights Reserved.