Image Details
Caption: Figure 9.
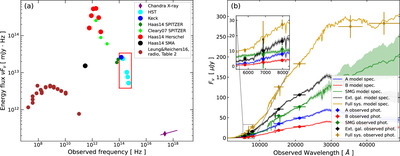
(a) Updated SED of the entire 3C 220.3 system. The optical fluxes include galaxy A (the AGN host), galaxy B, the surrounding extended emission, and the Einstein ring. The X-ray fluxes include the NW and SE lobe regions and were derived from their average flux densities through Sherpa analysis (Section 3.3). Radio flux densities comprise the radio lobes and core, when detected. Points show observed values from Table 8 and Leung & Riechers (2016, their Table 2) as indicated in the legend. The line through the X-ray point shows the estimated spectral slope, and the red box indicates the wavelength range used in the BAGPIPES simulations, shown in panel (b). (b) Visible to NIR flux densities of galaxy A (blue), galaxy B (red), extended galaxy (black), and the SMG (green). Stars show measured HST F606W, F702W, F814W, and F160W and Keck ﹩K^{\prime} ﹩ flux densities. Lines show the simulated, high-resolution BAGPIPES spectrum (Section 4.1) for each component. The full-system sum of both simulated and observed data points, including full-system IRAC 3.6 and 4.5 μm flux densities, are shown in yellow.
Other Images in This Article
Copyright and Terms & Conditions
© 2024. The Author(s). Published by the American Astronomical Society.