Image Details
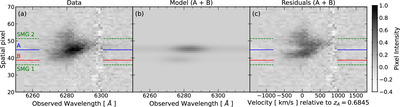
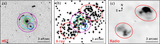
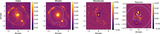
Caption: Figure 7.
Close-up of the [O II] emission line in the 2D spectrum. The horizontal axis is the wavelength for panels (a) and (b) and velocity relative to the redshift of galaxy A (z A = 0.6850) in panel (c). The vertical axis is the spatial position along the slit from SW to NE (Figure 1(a)). The scale, in 0.″24 pixels, is shown at the left. Panels left to right show the data, the galaxy A and B components of the 2D model, and the residuals after subtracting the galaxy A and B components from the data. Galaxy positions along the slit are marked in panels (a) and (c).
Other Images in This Article
Copyright and Terms & Conditions
© 2024. The Author(s). Published by the American Astronomical Society.