Image Details
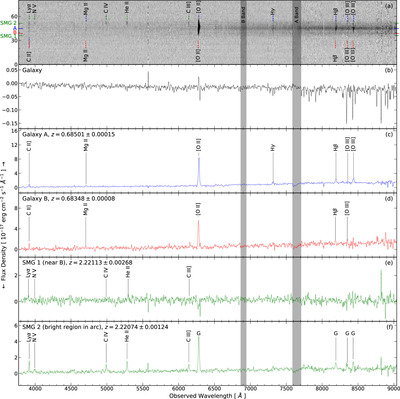
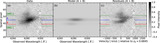
Caption: Figure 5.
Top: two-dimensional spectrum from MMT Binospec. Observed wavelength increases to the right. The vertical axis corresponds to the sky direction of the slit (Figure 1(a)), with the bottom corresponding to the southwest end of the slit. Component positions are marked at the left edge. Bottom five panels: extracted spectra of (top to bottom) the extended galaxy, galaxy A, galaxy B, the SW part of the SMG near B, and the NE part of the SMG. Emission lines are marked in each panel. Lines in panel (f) marked by a G are likely contamination from the extended galaxy or galaxy A. There is strong [O II] emission for both galaxy A and galaxy B. [O III], Hβ, Mg II, and C II] emission are also detected in both A and B spectra.
Other Images in This Article
Copyright and Terms & Conditions
© 2024. The Author(s). Published by the American Astronomical Society.