Image Details
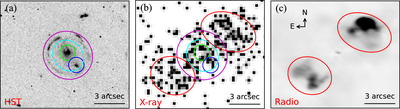
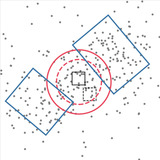
Caption: Figure 4.
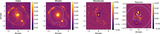
Negative images of the 3C 220.3 system. Left to right are visible (HST F606W+F814W), Chandra X-ray (0.5–8 keV, 0.″25 × 0.″25 subpixel binned, Gaussian smoothed with r = 1 pix), and VLA 9.0 GHz. Images are 12.″6 × 10.″5. Extraction regions shown, defined in Table 3, are 1 (galaxy A, green circle), 3 (galaxy B, blue circle), 5 (extended galaxy, cyan ellipse), 6 (Einstein ring, annulus between magenta and cyan ellipses), and 7 and 8 (NW and SE radio lobes, red ellipses). Region 9 (Table 3, not shown in this figure) measures the X-ray emission from the full source to allow comparison with lower-resolution X-ray data on this source.
Other Images in This Article
Copyright and Terms & Conditions
© 2024. The Author(s). Published by the American Astronomical Society.