Image Details
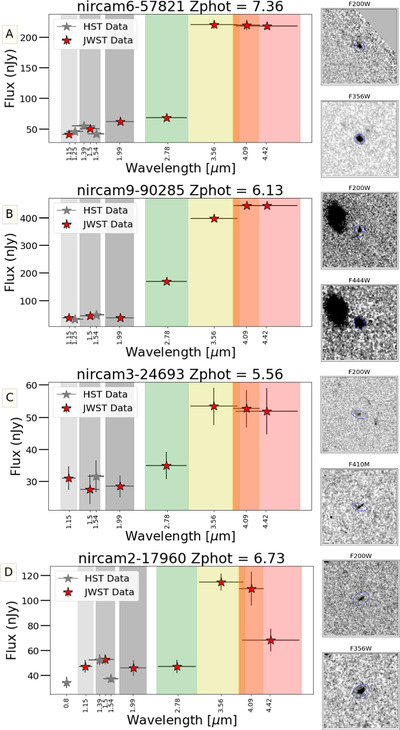
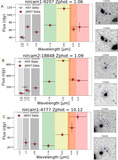
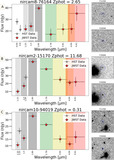
Caption: Figure 9.
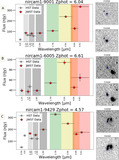
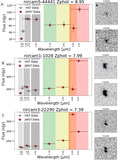
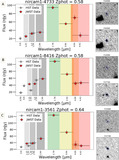
Example SEDs in which single extreme emission features impact more than one photometric filter. Photometry postage stamps show a continuum filter (top) and an extreme emission filter (bottom) with north up and east left. All postage stamps are 4″ in width and height. Panels (A)–(C): example SEDs from the category of sources with extreme emission in F356W, F410M, and F444W that are consistent with Hβ + [O III] and/or Hα emission blended across three or more (partially overlapping) filters. Deblending the emission-line contribution to each filter is nontrivial and our photometric measurement of the EW is likely to be unreliable, and so these sources are categorized in the lowest confidence Tier 3. Similar to panel (B) of Figure 8, panel (B) of this figure has an image that is significantly larger in the emission-line filter than the continuum, suggesting the presence of an extended ionization region. Panel (D): Hβ + [O III] blended across F356W and F410M. This extreme emission only impacts the broadband photometry in this way for a narrow redshift range (z ≈ 6.7), correctly identified by the photometric redshift code. We assign this source to Tier 1B for extreme emission in a single filter with a correct photometric redshift.
Other Images in This Article
Show More
Copyright and Terms & Conditions
© 2024. The Author(s). Published by the American Astronomical Society.