Image Details
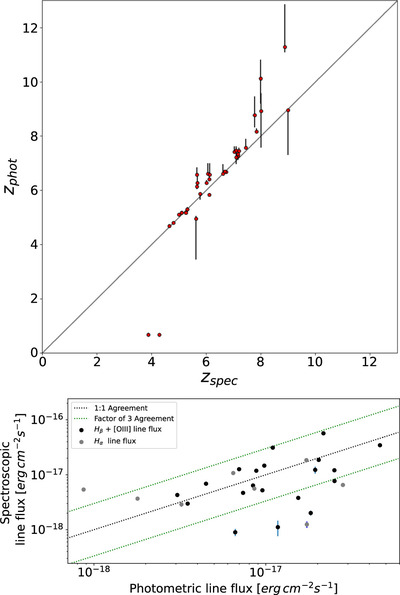
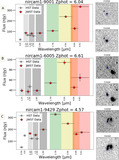
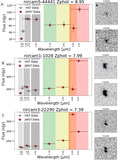
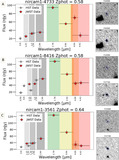
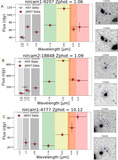
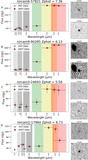
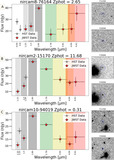
Caption: Figure 4.
Top: comparison between spectroscopic and photometric redshifts for spectroscopically confirmed EELGs. In all cases the spectroscopy confirms our EELG selection, although 4/34 sources have an incorrect z phot that disagrees with the spectroscopic redshift. Error bars represent 68% confidence ranges. Bottom: comparison of the spectroscopic and photometrically inferred emission-line flux for Hα and the sum of Hβ + [O III], for the 34 EELGs with NIRSpec spectra. Most line fluxes agree within a factor of 3, indicating the reliability of our photometric EELG selection and EW measurements. A small number (7) of the spectroscopic line measurements are underestimated by a factor of >3 compared to the photometry, likely due to aperture losses affecting the spectra.
Other Images in This Article
Show More
Copyright and Terms & Conditions
© 2024. The Author(s). Published by the American Astronomical Society.