

Image Details
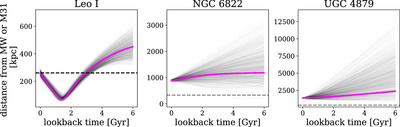
Caption: Figure 7.
An illustration of the range of uncertainties in orbital histories for galaxies with small (left), intermediate (middle), and large PM uncertainties (right). Leo I is plotted with respect to the MW, while NGC 6822 and UGC 4879 are plotted with respect to M31. Each panel also includes the virial radius of the MW or M31 in a black or dashed gray line, respectively. The magenta curve is the direct orbital history for each galaxy (i.e., the same as the direct orbits in Figure 5). The gray lines represent 1000 orbits spanning the uncertainty in the 6D phase space coordinates in Table 5. As expected, orbital uncertainties increase as a function of increasing distance.
Other Images in This Article

Copyright and Terms & Conditions
© 2024. The Author(s). Published by the American Astronomical Society.

