

Image Details
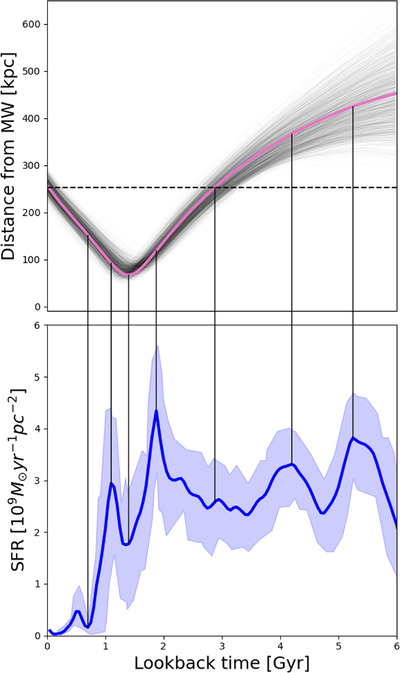
Caption: Figure 8.
The orbit for Leo I (upper panel) compared to its SFH (lower panel; Ruiz-Lara et al. 2021). The pink line shows the direct orbit for Leo I, and the gray lines show the other orbits drawn from our Monte Carlo ensemble based on the observational uncertainties (see Section 3.2). The blue line indicates the SFR over time for the past 6 Gyr, with the light-blue shape showing the uncertainties. The dashed black line in the upper panel indicates the virial radius of the MW (R vir = 251 kpc). Key times are linked between the panels with black lines.
Other Images in This Article

Copyright and Terms & Conditions
© 2024. The Author(s). Published by the American Astronomical Society.

Copyright ©
2026 Astronomy Image Explorer. All Rights Reserved.
