Image Details
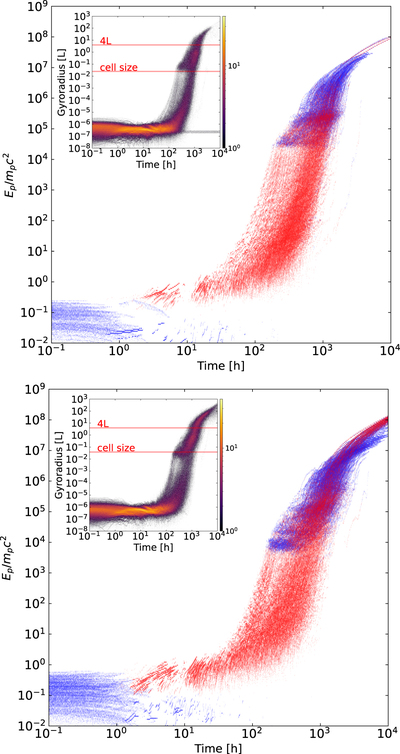
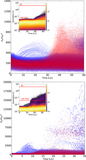
Caption: Figure 5.
Kinetic energy evolution, normalized by the proton rest mass energy, for 1000 particles injected into the fully turbulent snapshot t = 50 L/c of the σ ∼ 1 jet run by MGK+21 (top). The same for particles injected into the snapshot t = 45 L/c of the σ ∼ 1 jet in this work (bottom). The colors indicate which velocity component is being accelerated (red or blue for the parallel or perpendicular component to the local magnetic field, respectively). The insets in the upper left corner show the time evolution of the particle’s gyroradius. The color bars indicate the number of particles. The horizontal gray stripe is bounded on the upper part by the jet diameter (4L) and on the lower part by the cell size of the simulated background jet. In these particle simulations, the particle acceleration time is given in hours and the adopted physical size for L is the same as in MGK+21 for comparison, L = 3.5 × 10⁻⁵ pc.
Other Images in This Article

Copyright and Terms & Conditions
© 2023. The Author(s). Published by the American Astronomical Society.