Image Details
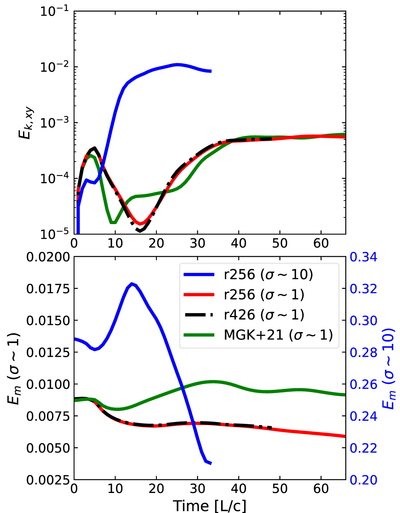
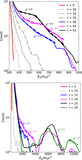
Caption: Figure 2.
Top: time evolution of the volume-averaged kinetic energy density transverse to the z-axis within a cylinder of radius R ≤ 3.0L for the σ ∼ 1 jet (red solid line for the model with resolution 2563 and dashed–dotted black line for the model with resolution 4262–256), and for the σ ∼ 10 jet (blue solid line). Bottom: volume-averaged relativistic electromagnetic energy density for the same models. For comparison, also plotted with dashed red lines, are the results obtained in MGK+21 for the σ ∼ 1. The kinetic energy is presented in the log scale, while E m is in the linear scale.
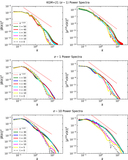
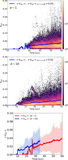
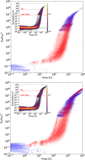
Other Images in This Article

Copyright and Terms & Conditions
© 2023. The Author(s). Published by the American Astronomical Society.