Image Details
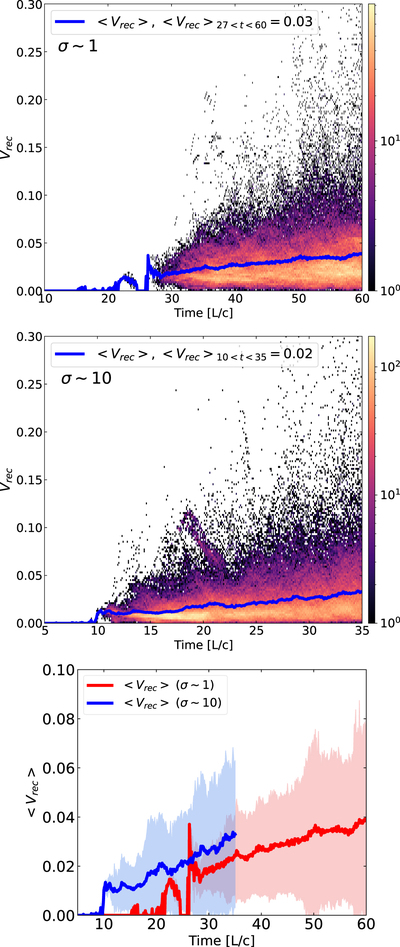
Caption: Figure 4.
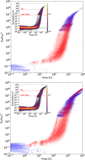
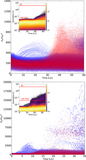
Histogram of the reconnection rate evolution for the σ ∼ 1 (top) and σ ∼ 10 jet (middle). The blue line gives the average reconnection rate evolution. The bottom diagram compares the average reconnection rate evolution of the two models and the colored shades correspond to the standard deviations of each model.
Other Images in This Article
Copyright and Terms & Conditions
© 2023. The Author(s). Published by the American Astronomical Society.
Copyright ©
2026 Astronomy Image Explorer. All Rights Reserved.