Image Details
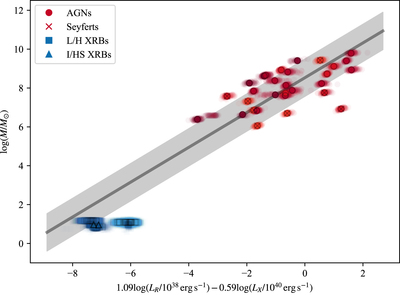
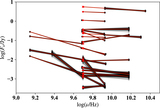
Caption: Figure 6.
Edge-on view of the fundamental plane with mass as dependent variable. Here we plot all data realized N times to show the correlated uncertainties. Colors are as in Figure 2, and symbols indicate whether the source is an AGN (red circles), a Seyfert AGN (red circle with cross), an XRB in a low/hard state (blue squares), or an XRB in an intermediate or high/soft state (blue triangles). Each source is sampled from its measurement uncertainties as is done in the fitting procedure and is plotted with a partially transparent symbol plus a dark outline symbol on top at the nominal values. We plot the best-fit relation as a dark gray line with a light gray shaded region to indicate the 1σ region of the Gaussian intrinsic scatter, which has magnitude of 1 dex. This figure summarizes the results of the fits as well as indicates the fidelity with which one can use the fundamental plane to estimate black hole mass.
Other Images in This Article

Copyright and Terms & Conditions
© 2019. The American Astronomical Society. All rights reserved.