Image Details
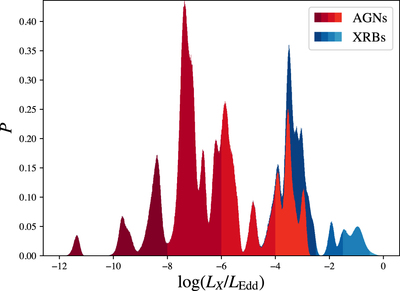
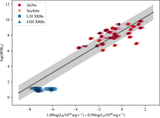
Caption: Figure 2.
Probability density of logarithmic 2–10 keV X-ray Eddington fraction. We plot multiple realizations of our sample using statistical uncertainties of X-ray flux, distance to source, and black hole mass. For AGN sources, we take into account the correlation between distance in the luminosity calculation and distance in the mass estimate. The multiple observations of individual XRBs are incorporated by weighting each as 1/N, where N is the number of observations of a given XRB. The probability density curves are colored according to mass category (red for AGNs and blue for XRBs) and the shade is given by the value of ﹩\mathrm{log}({L}_{X}/{L}_{\mathrm{Edd}})﹩. AGNs are grouped into the following discrete bins: ﹩(-\infty ,-8)﹩, [−8, −6), [−6, −4), and ﹩[-4,+\infty )﹩. XRBs are grouped into the following discrete bins: ﹩(-\infty ,-2.5)﹩, [−2.5, −1.5), [−1.5, −0.5), and ﹩[-0.5,+\infty )﹩. We use this color scheme in figures throughout this paper. Note that the probability density plotted is the total probability density of all sources so that at, e.g., ﹩\mathrm{log}({L}_{X}/{L}_{\mathrm{Edd}})=-4,﹩ the probability density is dominated by AGNs with a small contribution coming from XRBs. The nearly 10 orders of magnitude in X-ray Eddington fraction covered by our sample is illustrated in this figure.
Other Images in This Article

Copyright and Terms & Conditions
© 2019. The American Astronomical Society. All rights reserved.