Image Details
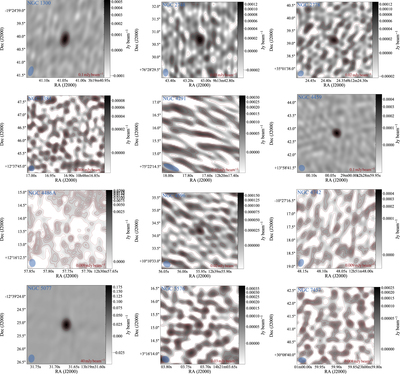
Caption: Figure 8.
VLA maps of our new 8.4 GHz X-band observations of 12 sources. Grayscale is indicated by the bar to the right of each panel, and the contours are in constant steps of the value indicated in the lower-right corner of each panel. The blue ellipse in the lower-right corner of each panel shows the size and position angle of the synthesized beam. The maps are centered on the brightest pixel within a 20 × 20 pixel region centered on the Simbad coordinates for the host galaxy. When the source is securely detected, it is always consistent with a point source. We list the integrated flux densities and upper limits in Table 1.
Other Images in This Article

Copyright and Terms & Conditions
© 2019. The American Astronomical Society. All rights reserved.