

Image Details
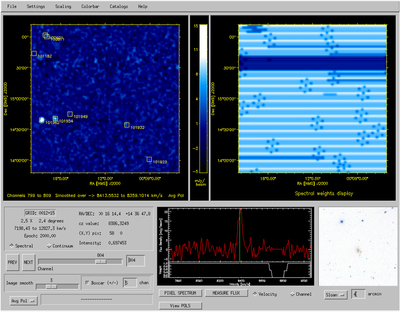
Caption: Figure 7.
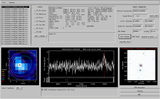
GridView application GUI created in IDL. The data-cube visualization procedure incorporates various IVOA web service tools for use during the data analysis process. The figure shows both optical image viewing and catalog overlay on the H I line zeroth-moment map over an adjustable range of channels (left). The display to the right of the moment map shows the corresponding weight map of the same region; horizontal stripes in the weights map reflect the interleaved drift-scan strategy and scalloped nature of coverage by beams of different gain. In that display, dark means low weight; there is a drift missing from this data set. The repeated pattern of seven darker spots represents the interruption of data-taking for the firing of the noise diode (every 600 s); the seven spots are the seven ALFA beams. The target under analysis here is AGC 101962, matching the brightest white spot on the left just below the center of the moment map. Its spectrum is shown near the center bottom; the spectral weight display, plotted underneath the flux density, indicates that the spectral range near the galaxy’s H I emission is fine, but the spectral region around 8700 km s−1 is of low weight due to excision of RFI generated by the NUDET instrument on the GPS constellation of satellites and an internal modulation of the FAA radar. The bottom right window displays the SDSS r-band image of the field centered on the H I centroid. Users are able to manipulate the 3D spectral grid with the various GUI controls, export maps, view polarizations separately, and examine the spectrum corresponding to any grid pixel.
Other Images in This Article
Copyright and Terms & Conditions
© 2018. The American Astronomical Society. All rights reserved.

