

Image Details
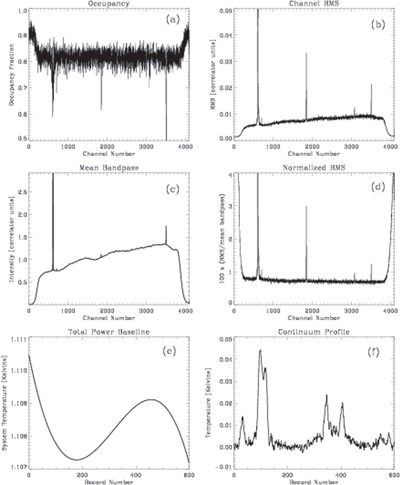
Caption: Figure 4.
Plots showing the products, statistics, and diagnostics of the bandpass calibration for a single 600 s drift. Panel (a) shows the occupancy fraction of records that are within 2 × rms of the time-series fit for each channel, (b) shows the rms for each channel, (c) is the mean bandpass of the strip, (d) is the rms divided by the mean bandpass multiplied by a factor of 100, (e) shows the continuum baseline contribution after removal of point sources, and (f) shows the continuum “strip chart” integrated along good channels. All data shown are for the same polarization (“A”) of one of the outer beams (“Beam 4”).
Other Images in This Article
Copyright and Terms & Conditions
© 2018. The American Astronomical Society. All rights reserved.

