

Image Details
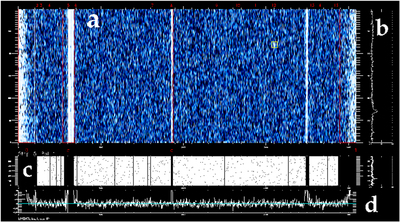
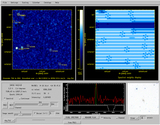
Caption: Figure 6.
Example session of RFI flagging from 2005 April 4. The user selects regions of interference via predetermined box numbers or user-defined regions. Cross-referencing with optical and H I databases allows the user to check known information during the data reduction session. The figure sections are as follows: (a) the main time vs. frequency plot of the data showing the FAA radar and Galactic H I, (b) the continuum flux integrated along the strip, (c) the map mask showing the pixels (in white) used by the bandpass calibration procedure to produce the continuum flux strip, and (d) the average spectrum for all 600 records. Prominent features (indicated by white vertical stripes) include, from left to right, the strong FAA radar at 1350 MHz, an internally generated modulation of the radar at 1380 MHz, and the Galactic H I emission at 1420 MHz. Red boxes indicate marked regions of RFI, and the yellow box indicates a galaxy previously identified in the AGC database at the corresponding position and redshift.
Other Images in This Article
Copyright and Terms & Conditions
© 2018. The American Astronomical Society. All rights reserved.

