

Image Details
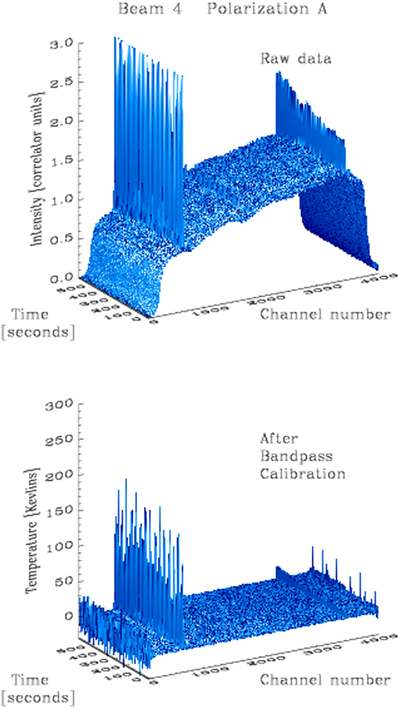
Caption: Figure 5.
A 2D surface illustrating the bandpass calibration and subtraction process for a representative time/frequency (spectrometer “channel number”) plot for one polarization (“A”) of a single beam (“Beam 4”) over a 600 s drift. The upper plot shows the raw ALFALFA drift-scan spectral data, clipped to an intensity of 3.0 for dynamic range convenience. The bottom plot shows the spectral data, scaled to Kelvins, after the bandpass calibration process. Features in both plots include the FAA radar signature near channel 615 (1350 MHz) and the Galactic H I line emission near channel 3500 (1420 MHz).
Other Images in This Article
Copyright and Terms & Conditions
© 2018. The American Astronomical Society. All rights reserved.

Copyright ©
2026 Astronomy Image Explorer. All Rights Reserved.
