Image Details
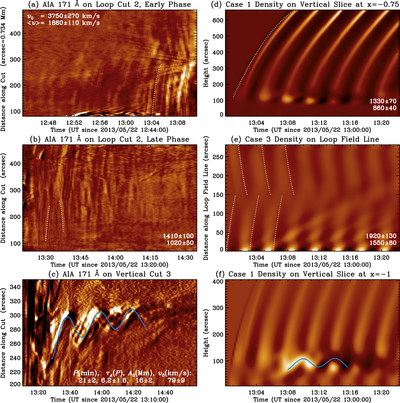
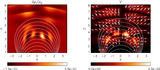
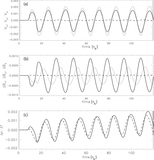
Caption: Figure 9.
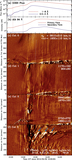
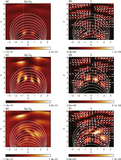
Comparison of space–time plots from the observations (left) and simulations (right) showing the deceleration of QFPs with distance (top panels), counter-propagating waves (middle panels), and trapped kink oscillations (bottom panels). See the text for details.
Other Images in This Article
Show More
Copyright and Terms & Conditions
© 2018. The American Astronomical Society. All rights reserved.
Copyright ©
2026 Astronomy Image Explorer. All Rights Reserved.