Image Details
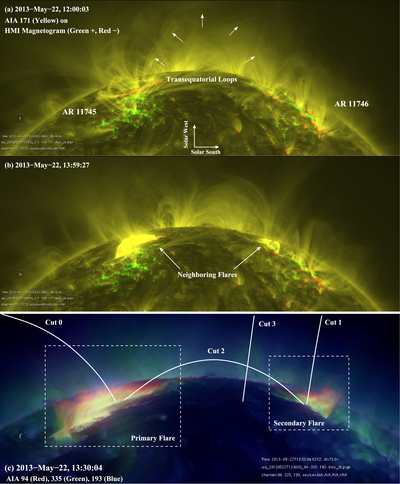
Caption: Figure 1.
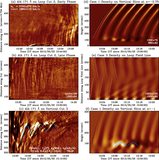
Context SDO/AIA images of the 2013 May 22 M5.0 flare/QFP event, rotated by 90° counterclockwise with the solar west up. (a) Pre-flare 171 Å image (yellow) at 12:00 UT overlaid on the concurrent HMI magnetogram (green and red for positive and negative polarities, respectively). The short arrows mark the trans-equatorial loops that connect the two ARs, 11745 and 11746. (b) Same as panel (a) but later, at 13:59 UT, showing the neighboring flares, where QFP wave trains originate. (c) Composite image of three AIA channels of decreasing characteristic temperature: 94 Å (red), 335 Å (green), and 193 Å (blue) at 13:30 UT, when the flare is most evident in the hottest channel (red). We mark four spatial cuts, 0–3, used to obtain space–time plots and two boxed regions used to obtain the individual flare light curves, both shown in Figure 4. (An animation of the top two panels showing the SDO/AIA images from 12:00 to 13:59 UT is available online.)
(An animation of this figure is available.)
The video/animation of this figure is available in the online journal.
Other Images in This Article
Show More
Copyright and Terms & Conditions
© 2018. The American Astronomical Society. All rights reserved.