Image Details
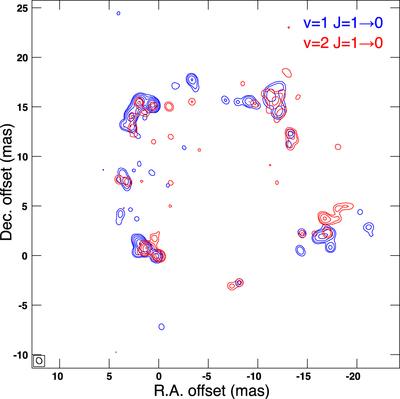
Caption: Figure 3.
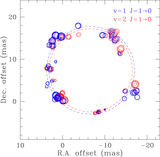
Integrated intensity map of the SiO masers around WX Psc. The blue contour represents the v = 1 J = 1 → 0 SiO maser, and the red contour represents the v = 2 J = 1 → 0 SiO maser. The peak flux is 16.01 Jy beam−1 km s−1 for the v = 1 and 5.50 Jy beam−1 km s−1 for the v = 2 SiO maser. The rms noise levels of the v = 1 and v = 2 SiO maser maps are 16.0 mJy beam−1 km s−1 and 15.4 mJy beam−1 km s−1, respectively. The contour levels are 0.24, 0.48, 1.12, 2.56, 5.12, and 10.24 Jy beam−1 km s−1 for both SiO maser lines.
Other Images in This Article
Copyright and Terms & Conditions
© 2016. The American Astronomical Society. All rights reserved.
Copyright ©
2025 Astronomy Image Explorer. All Rights Reserved.