Image Details
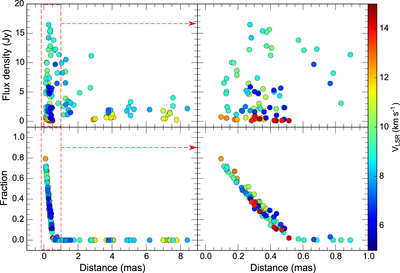
Caption: Figure 7.
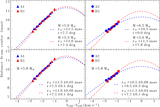
Upper panels: flux density of the individual v = 1 J = 1 → 0 SiO maser spot against the angular distance to the nearest v = 2 J = 1 → 0 SiO maser spot with the same velocity. Lower panels: fraction of the overlapping area of the closest v = 1 and v = 2 SiO maser spots used in the upper plot against the angular separation between those spots. Right panels: close up plots of the red dashed boxes of the left panels for a distance smaller than 1 mas. The most blueshifted (<7 km s−1) and redshifted (>13 km s−1) spots are overplotted on the rest of the spots. Color represents the velocity of the SiO maser spots shown in the all panels.
Other Images in This Article
Copyright and Terms & Conditions
© 2016. The American Astronomical Society. All rights reserved.