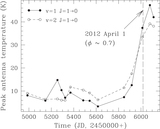
Image Details
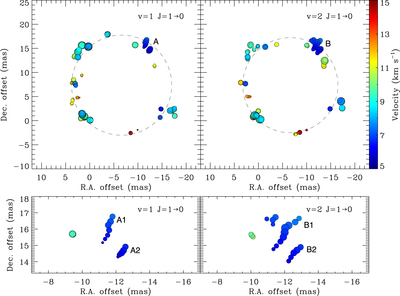
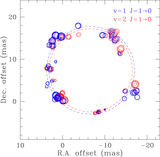
Caption: Figure 4.
Upper panels: velocity–position maps of the SiO masers around WX Psc. Color represents the velocity, and the filled circle represents the individual maser spot of which the area is proportional to the flux density logarithmically. The size of the largest filled circle in the left panel is adjusted to be equal to that of the right panel for convenience. The dashed ring of each panel is determined from the circular fitting of the distributions of the maser spots. Lower panels: close up plots for the northwestern parts (marked A and B) of the upper panels. The feature denoted as A is divided into two components, A1 and A2, and the feature B is also divided into two components, B1 and B2.
Other Images in This Article
Copyright and Terms & Conditions
© 2016. The American Astronomical Society. All rights reserved.