Image Details
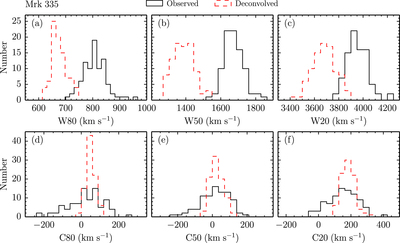
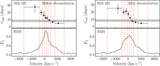
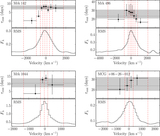
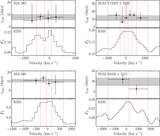
Caption: Figure 8.
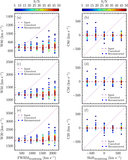
A comparison of widths and shifts before and after the deconvolution (Mrk 335). Panels (a)–(f) are W80, W50, W20, C80, C50, and C20, respectively. The black solid lines are the distributions in the observed profiles, and the red dashed lines are the distributions in the reconstructed profiles after the deconvolution.
Other Images in This Article
Copyright and Terms & Conditions
© 2016. The American Astronomical Society. All rights reserved.
Copyright ©
2026 Astronomy Image Explorer. All Rights Reserved.