Image Details
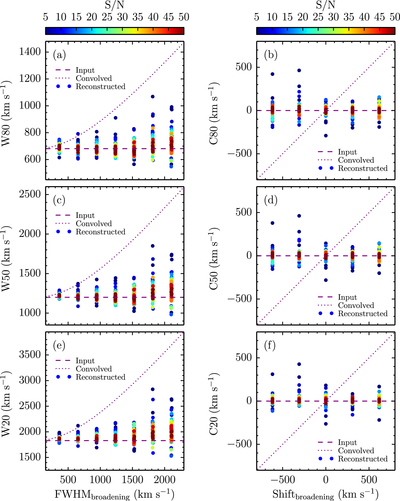
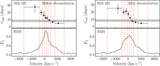
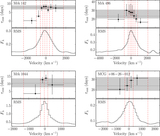
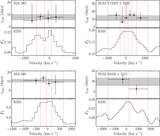
Caption: Figure 6.
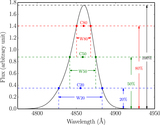
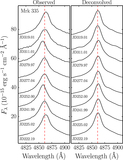
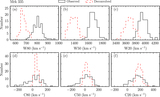
Comparisons of Hβ profiles between the input and output spectra in the Monte Carlo simulation. FWHM﹩{}_{{\rm{broadening}}}﹩ and Shift﹩{}_{{\rm{broadening}}}﹩ are the width and shift of the broadening function ξ. The dashed lines mark the values of (W20, W50, W80) and (C20, C50, C80) in the input artificial spectrum, while the dotted lines show their values in the convolved output spectra. The points are (W20, W50, W80) and (C20, C50, C80) of the profiles in the reconstructed spectra after the deconvolution. The colors show the S/Ns we set in the simulated observed spectra. The reconstruction is more successful in the cases of narrower broadening function and higher S/Ns.
Other Images in This Article
Copyright and Terms & Conditions
© 2016. The American Astronomical Society. All rights reserved.