

Image Details
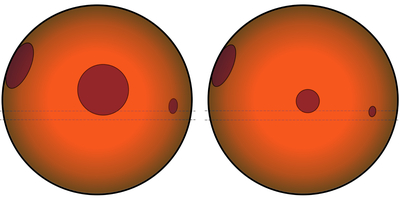
Caption: Figure 5.
Stellar photosphere map (left: F21/G141, right: S22/G102) with associated active region locations and sizes measured by the astrophysical white-light-curve model. These models of the surface of AU Mic are simplifications based on a single bandpass and do not illustrate the complex reality of spot morphology. Rather, the locations and sizes of these spots represent the simplest configuration we explored that could describe apparent spot occultations and rotational modulation of the data.
Other Images in This Article
Show More
Copyright and Terms & Conditions
© 2026. The Author(s). Published by the American Astronomical Society.

Copyright ©
2026 Astronomy Image Explorer. All Rights Reserved.
