

Image Details
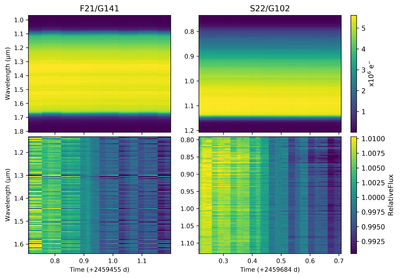
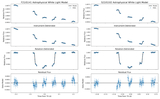
Caption: Figure 2.
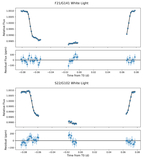
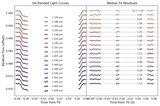
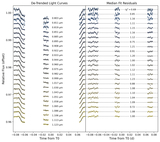
Top row: spectroscopic light curves for visit F21/G141 (left column) and S22/G102 (right column) as they are returned from the PACMAN pipeline, with the temporal gaps between orbits removed. Bottom row: after trimming the wavelength edges and mean-normalizing each light curve, the effect of poor tracking stands as horizontal stripes of alternating bright and dark intensity, due to spectral lines wobbling in and out of the wavelength bin. Observations from visit F21/G141 noticeably show a worse effect than S22/G102, but the same issue is present in both visits.
Other Images in This Article

Show More
Copyright and Terms & Conditions
© 2026. The Author(s). Published by the American Astronomical Society.

Copyright ©
2026 Astronomy Image Explorer. All Rights Reserved.
