

Image Details
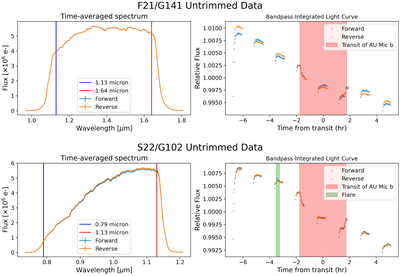
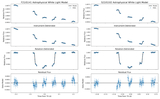
Caption: Figure 1.
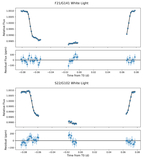
Median spectra and white-light curves for the first (top row) and second visit (bottom row) with trim regions indicated on the left panel. The transit light curves show the typical WFC3 systematic ramp effect, with the first orbit in each visit experiencing the most dramatic effect. At least one flare is clear in the data, highlighted in green in the 2nd orbit of S22/G102. The flux offset between scan directions is more noticeable in the G141 observations.
Other Images in This Article

Show More
Copyright and Terms & Conditions
© 2026. The Author(s). Published by the American Astronomical Society.

Copyright ©
2026 Astronomy Image Explorer. All Rights Reserved.
