

Image Details
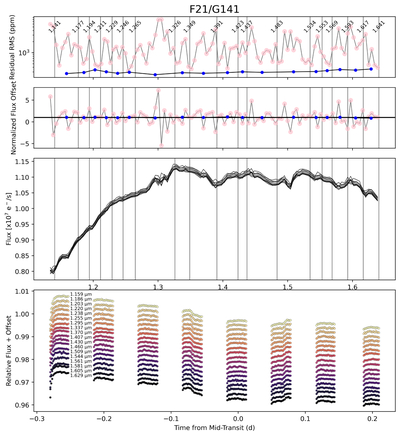
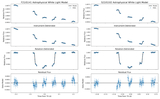
Caption: Figure 3.
Binning scheme for F21/G141 with vertical red bars to denote the bin edges. Top row: standard deviation of the residual rms calculated for a linear model fit to that wavelength’s light curve, both for the unbinned light curves (pink) and the resulting binned light curves (blue). Second row: median-flux offset between orbit 2 and orbit 1 for each instrument-resolution (pink) and binned (blue) light curve, normalized to the equivalent calculation in the bandpass-integrated light curve. Third row: time-series spectra (unbinned in time or wavelength) overplotted to demonstrate how much variation there is in time in the observed spectra. Bottom row: binned light curves used in this analysis.
Other Images in This Article

Show More
Copyright and Terms & Conditions
© 2026. The Author(s). Published by the American Astronomical Society.

