

Image Details
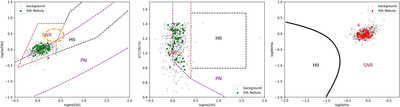
Caption: Figure 8.
Left and middle panels: SNR diagnostic model from L. Sabin et al. (2013), where green points mark locations on the [O III] structure and gray points mark the background. The orange circle marks the distribution of DIG regions in the BPT diagrams. Right panel: 2D diagnostic model proposed by M. Kopsacheili et al. (2020), with red points indicating data located on the [O III] structure.
Other Images in This Article
Copyright and Terms & Conditions
© 2026. The Author(s). Published by the American Astronomical Society.

Copyright ©
2026 Astronomy Image Explorer. All Rights Reserved.
