

Image Details
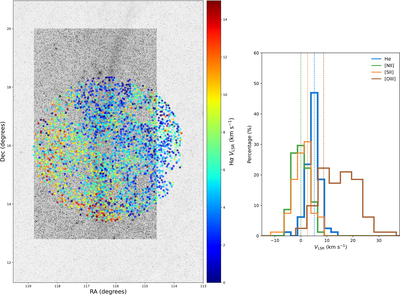
Caption: Figure 5.
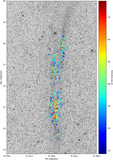
Two-dimensional spatial distributions (left panel) of VLSR (in km s−1) measured with Hα and the histograms (right panel) of VLSR of the Hα, [N II], [S II], and [O III] emission lines.
Other Images in This Article
Copyright and Terms & Conditions
© 2026. The Author(s). Published by the American Astronomical Society.

Copyright ©
2026 Astronomy Image Explorer. All Rights Reserved.
