

Image Details
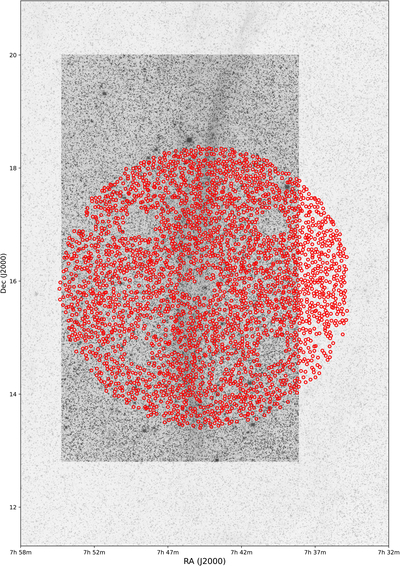
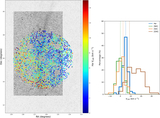
Caption: Figure 2.
Fiber distribution of test sky area. Red circles are coordinates of 4000 fibers. The grayscale background shows the Hα filter image, the colored overlay represents the [O III] filter image. Together to fully illustrate the LAMOST field of view coverage and the location of the Silk Nebula.
Other Images in This Article
Copyright and Terms & Conditions
© 2026. The Author(s). Published by the American Astronomical Society.

Copyright ©
2026 Astronomy Image Explorer. All Rights Reserved.
