

Image Details
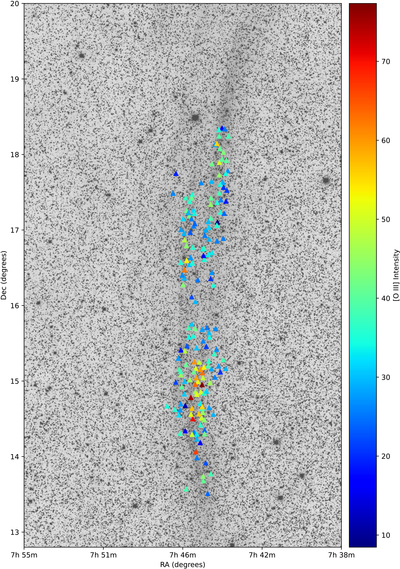
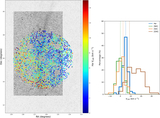
Caption: Figure 4.
Relative [O III] intensity distribution map. Plotted points mark the positions where [O III] emission is detected, regions without significant [O III] emission remain blank to avoid the impact of large flux-measurement uncertainties.
Other Images in This Article
Copyright and Terms & Conditions
© 2026. The Author(s). Published by the American Astronomical Society.

Copyright ©
2026 Astronomy Image Explorer. All Rights Reserved.
