

Image Details
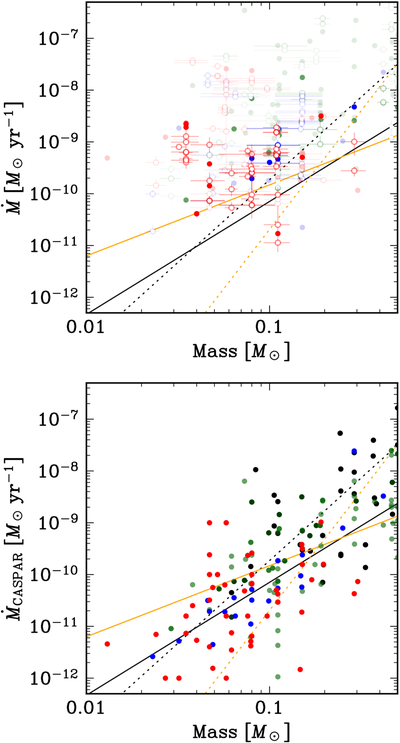
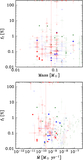
Caption: Figure 8.
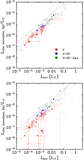
Mass-accretion rates derived in this work (upper panel) and in the CASPAR dataset (S. K. Betti et al. 2023; lower panel), shown as a function of object mass. The black points in the lower panel correspond to the N case, which could not be fitted with the shock model and is therefore not shown in the upper panel. Otherwise, the colors and symbols are the same as in Figure 6. The black lines show the broken power-law fits reported by S. K. Betti et al. (2023), written as ﹩{\mathrm{log}}_{10}\dot{M}=a{\mathrm{log}}_{10}{M}_{* }+b﹩: (a, b) = (2.18, −7.97) for M* > 0.075 M⊙ (solid lines) and (a, b) = (3.19, −6.54) for M* < 0.075 M⊙ (dotted lines). The orange lines show the corresponding fits from J. M. Alcalá et al. (2017): (a, b) = (1.37, −8.46) for M* > 0.2 M⊙ (solid lines) and (a, b) = (4.58, −6.11) for M* < 0.2 M⊙ (dotted lines).
Other Images in This Article
Show More
Copyright and Terms & Conditions
© 2026. The Author(s). Published by the American Astronomical Society.

