

Image Details
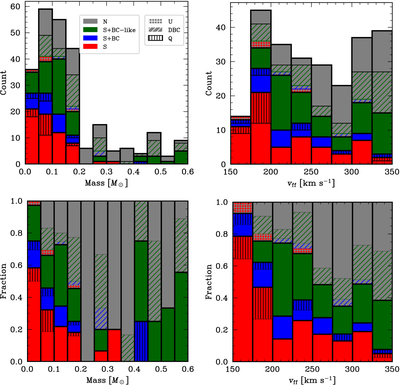
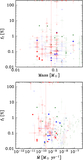
Caption: Figure 5.
Histogram of count (upper) and fraction (lower) of classification of emission mechanism relative to mass (left) and freefall velocity (right). Grid and diagonal hatches denote the U and DBC, respectively, and hatch color shows the original category (see Section 3.3). In addition, a vertical hatching indicates that we use model-parameter extrapolation to get a likely fit.
Other Images in This Article
Show More
Copyright and Terms & Conditions
© 2026. The Author(s). Published by the American Astronomical Society.

Copyright ©
2026 Astronomy Image Explorer. All Rights Reserved.
