

Image Details
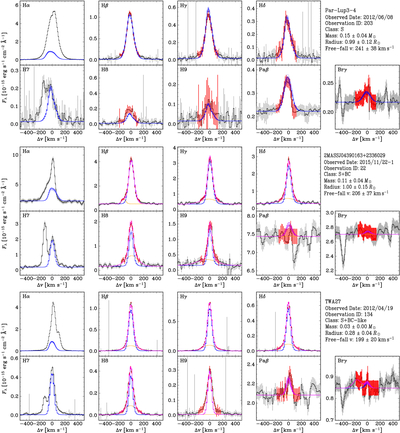
Caption: Figure 2.
Spectral profiles of hydrogen lines for OBS-203 (Par-Lup3-4), OBS-22 (2MASS J04390163+2336029), and OBS-134 (TWA 27) from top to bottom. With Δv and Fλ, we denote the velocity offset from line center and the spectral flux density, respectively. For OBS-203 (Par-Lup3-4), the top panel shows a good agreement between the model (blue line), which is randomly drawn from the MultiNest posterior, and observation (red error bars). For OBS-22 (2MASS J04390163+2336029), the middle panel shows the shock-emission model alone fails to reproduce the observation especially in the wing part, consistent with the previous flux-ratio analysis (J. Hashimoto & Y. Aoyama 2025). However, with considering a Gaussian BC (orange line), the shock model + BC (pink) well reproduces the observation. OBS-134 (TWA 27) in the bottom panel is also largely reproduced by shock model + BC, but the fit is statistically rejected. In either case, only Hα is much fainter in the model than the observation, indicating a strong additional emission component.
Other Images in This Article
Show More
Copyright and Terms & Conditions
© 2026. The Author(s). Published by the American Astronomical Society.

