

Image Details
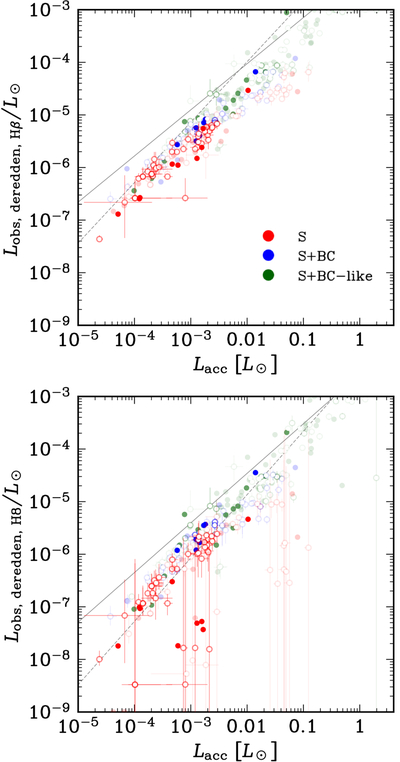
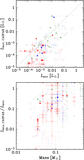
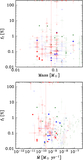
Caption: Figure 6.
Relationship between accretion luminosity (Lacc) and the luminosities of Hβ (upper) and H8 (lower), all normalized by the solar luminosity L⊙. The subscript “dereddened” denotes line luminosities additionally dereddened using the estimated local extinction. Red, blue, and green symbols correspond to the estimates in S (pure shock emission), S + BC (shock emission + BC), and S + BC–like (potentially explained by S + BC under a relaxed statistical criterion), respectively. Transparent symbols denote less-confident estimates (see Appendix C.4). Although they are individually less reliable, they may still provide useful information on the population trend, particularly near the fitting-grid boundary at large Lacc in these plots. When the mean value falls outside the plotting range, the corresponding symbol is placed at the edge of the plot. Open symbols indicate that another accepted mode exists for the same observation. The solid and dashed lines show the empirical Lacc–line luminosity relations derived from observations (J. M. Alcalá et al. 2017; solid line) and from shock-emission model predictions (Y. Aoyama et al. 2021; dashed line).
Other Images in This Article
Show More
Copyright and Terms & Conditions
© 2026. The Author(s). Published by the American Astronomical Society.

