

Image Details
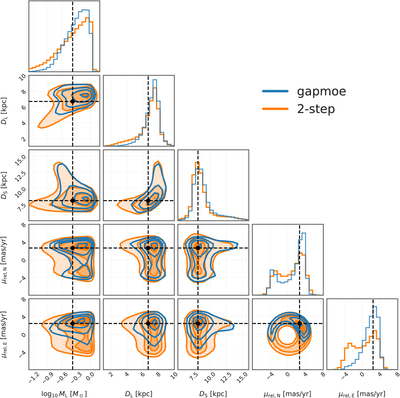
Caption: Figure 4.
Comparison of posterior distributions for selected physical parameters of Event 2. The blue contours show the posterior obtained with our gapmoe-based framework, while the orange contours show those from the conventional two-step analysis. Black dashed lines indicate the true input values. Other parameters are summarized in Table 2.
Other Images in This Article
Copyright and Terms & Conditions
© 2026. The Author(s). Published by the American Astronomical Society.

Copyright ©
2026 Astronomy Image Explorer. All Rights Reserved.
