

Image Details
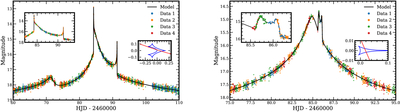
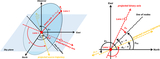
Caption: Figure 2.
Simulated I-band microlensing light curves for Event 1 (left) and Event 2 (right). Event 1 represents a typical event with a strong parallax signal, whereas Event 2 represents a typical event with weak higher-order signals. The main panels show the multiband light curves and the input models. Data 1–4 correspond to the four observing sites. Insets highlight the anomaly regions and the caustic structures.
Other Images in This Article
Copyright and Terms & Conditions
© 2026. The Author(s). Published by the American Astronomical Society.

Copyright ©
2026 Astronomy Image Explorer. All Rights Reserved.
